
Bitcoin Defends Key Support
Bitcoin holds key support as traders watch for a possible breakout toward $67,000.


Bitcoin remains under short-term selling pressure but continues to trade above a key support zone. The price is currently hovering around $65,300, and the next few sessions may determine whether buyers will make another attempt to break through resistance at $67,000.
On the 15-minute chart, Bitcoin is moving within a short-term descending channel. After bouncing from its lower boundary, the price has once again approached the channel’s upper trendline, which now represents the nearest resistance level. A breakout above it would be the first sign that selling pressure is easing, although it would not yet confirm a full return to an upward trend.
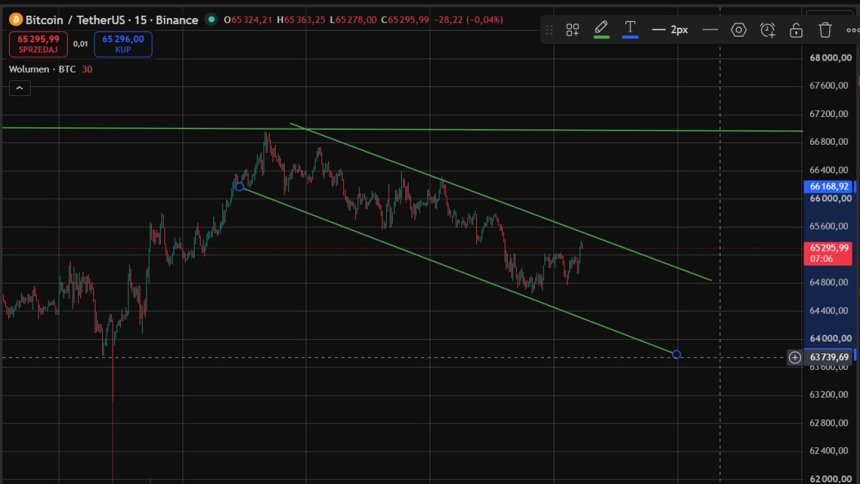
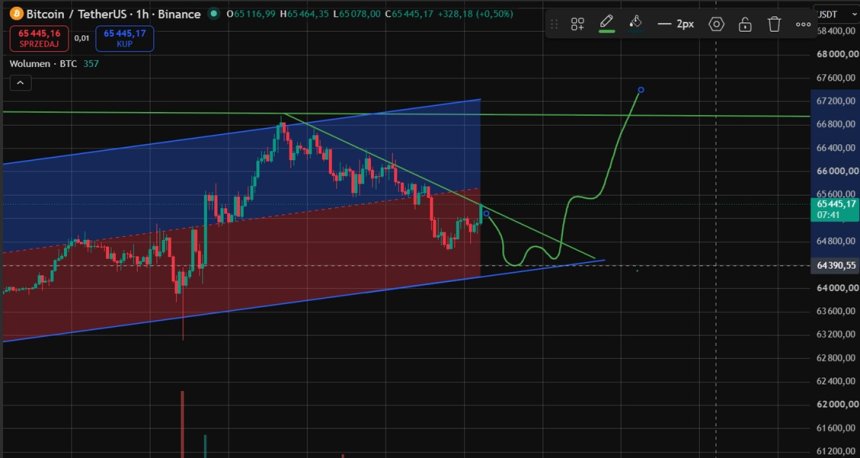
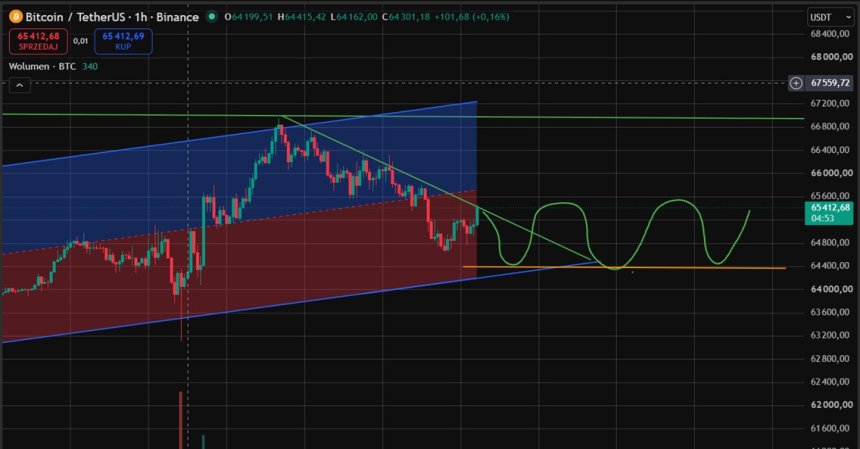
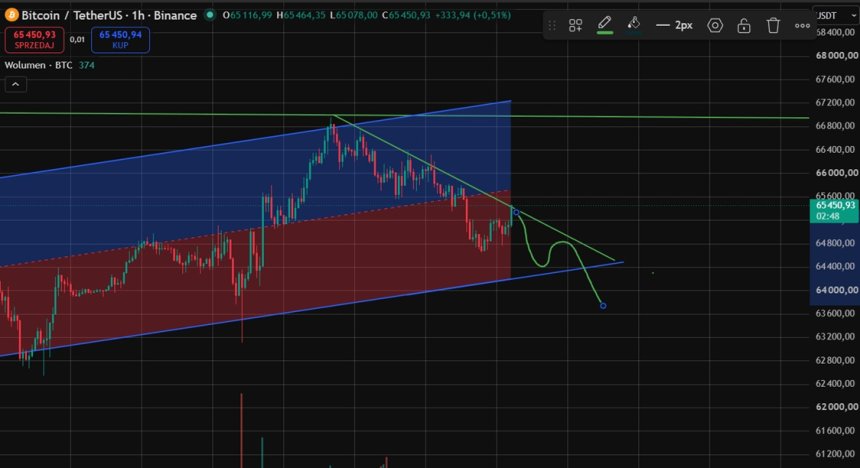
The hourly chart shows that Bitcoin remains within a broader ascending channel, even though the ongoing correction is still taking place below a descending trendline. If buyers manage to break above this line, the price could once again move toward $67,000.
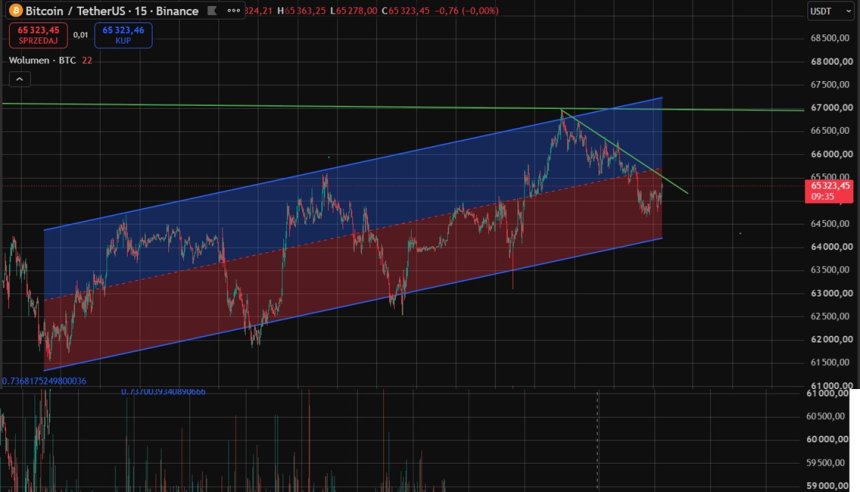
Before another attempt to overcome this resistance, however, Bitcoin needs to hold the support zone around $64,200–$64,400. Defending this area would preserve the bullish structure visible on the hourly chart. A drop below this support, on the other hand, would increase the risk of a deeper correction and could push the price toward lower levels.
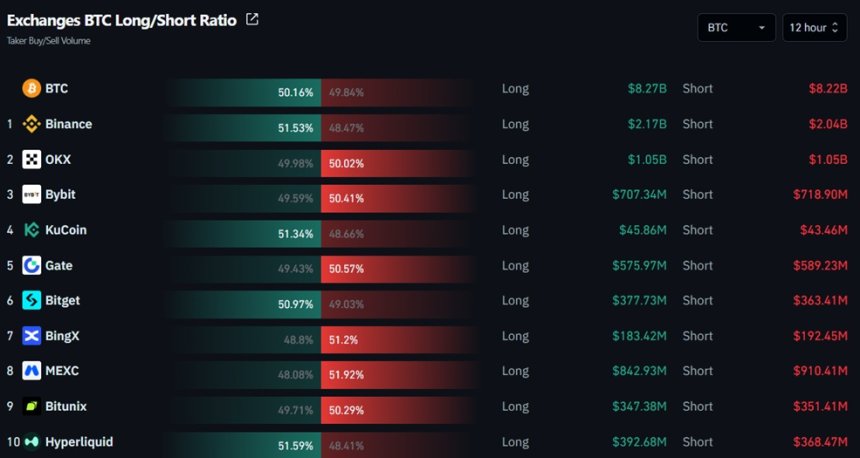
There is currently no clear advantage for either side across the largest exchanges. Buyers account for 50.16% of the analyzed trading volume, while sellers represent 49.84%. This near-perfect balance reflects continued uncertainty about Bitcoin’s next move.
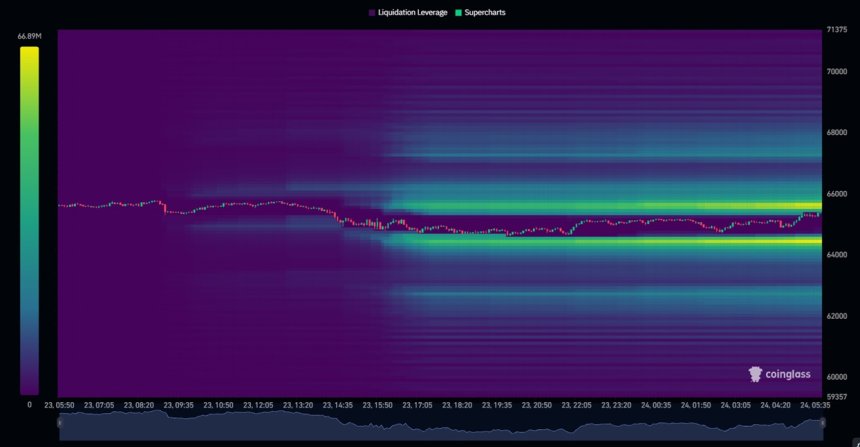
The liquidation map highlights price levels at which exchanges may automatically close a large number of leveraged positions. If Bitcoin rises to $65,500–$65,700, it could trigger numerous short liquidations—positions betting on a price decline. If the price falls to $64,300–$64,500, long positions betting on further gains may come under pressure.
Guidance for Traders
Bullish scenario: Bitcoin may first retest support in the $64,200–$64,400 area. If buyers defend this zone, the price could rebound, break above the descending trendline, and clear the nearest resistance at $65,500–$65,700. In that case, the next target would be $67,000. A sustained breakout above this level could open the way toward $67,200–$67,500.
Consolidation scenario: If Bitcoin holds support around $64,200–$64,400 but fails to break above the descending trendline and the $65,500–$65,700 resistance zone, the price may continue moving between these levels. This consolidation could persist until either buyers or sellers gain a clear advantage.
Bearish scenario: If Bitcoin fails to hold the lower boundary of the ascending channel and falls below the $64,200–$64,400 support zone, selling pressure could increase significantly. In that case, the price may move toward $63,600–$63,800.
Disclaimer: This material is provided for informational and educational purposes only. It does not constitute investment advice or an invitation to buy, sell, or trade cryptocurrencies. The cryptocurrency market is highly volatile, and every investment decision should be based on independent research and take into account the risk of losing capital.