Solana Defends Support at $73
Solana holds the $73 line — can buyers reclaim $75 and shift momentum back in their favor?


Solana failed to hold its key $75 support level, deepening its short-term correction. The price slipped toward $73, where buyers stepped back in. SOL is currently trading around $74.20, though the bounce remains modest and selling pressure is still evident.
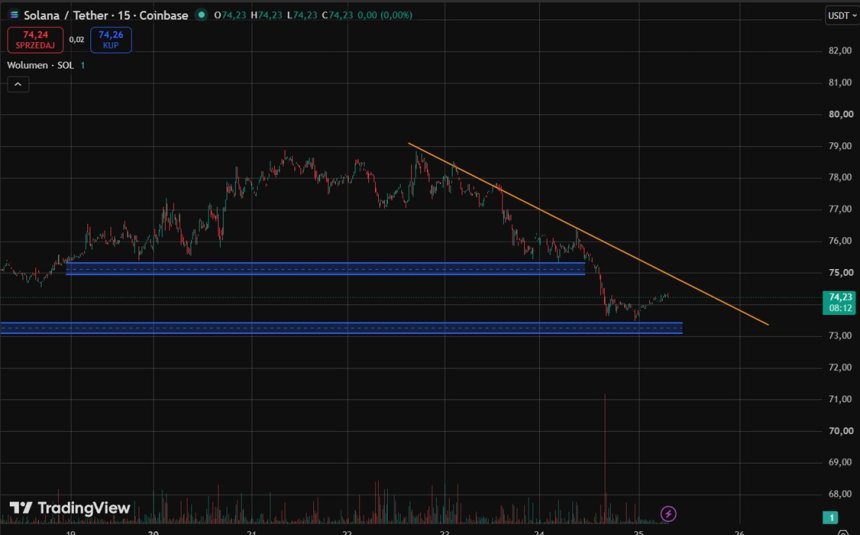
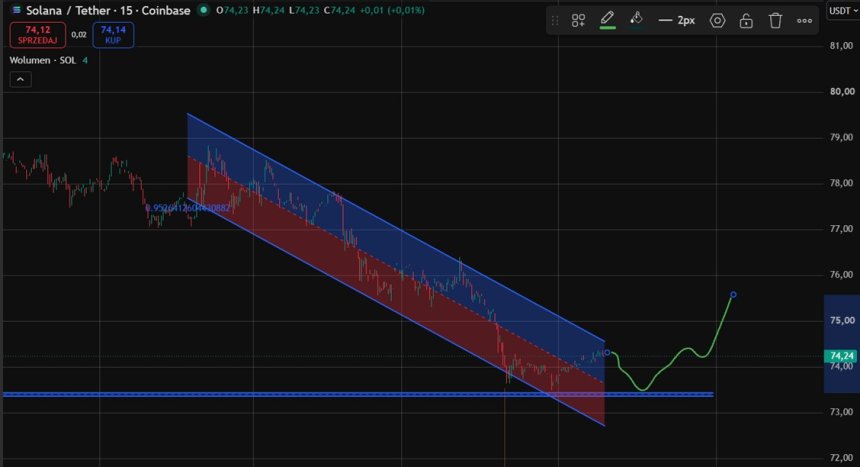
On the 15-minute chart, Solana is trading below a descending trendline, which now acts as the nearest dynamic resistance. The $73.00–$73.30 zone has been defended for the moment, but only a move back above $75 would meaningfully improve the short-term picture. A retest of the $73 level will show whether buyers can hold this new support on a lasting basis.
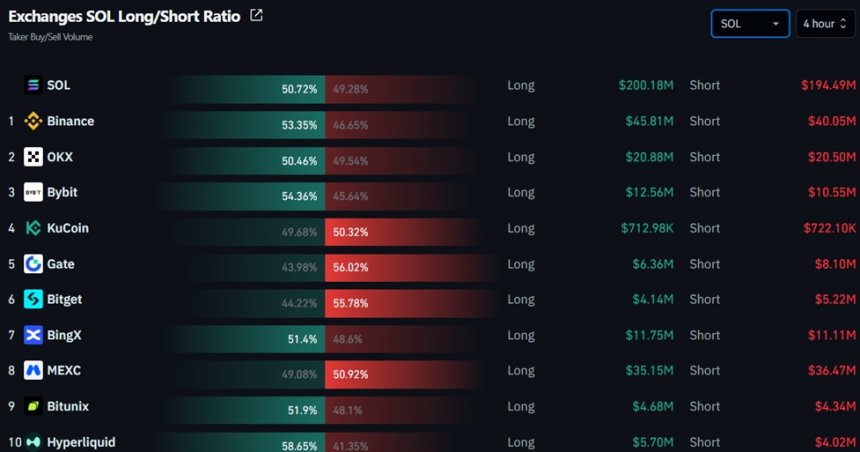
Sentiment across major exchanges leans slightly bullish. Buyers account for 50.72% of the analyzed volume, versus 49.28% for sellers. Buy-side transaction value stands at roughly $200.18 million, compared to $194.49 million on the sell side. The gap remains narrow, pointing to a near-balanced market with no clear edge for either side.
The liquidation map shows that a move up toward $76.50–$76.80 could trigger a wave of short liquidations — bets against the price. Conversely, a drop below the $73 support would raise the risk of long liquidations, which could add further selling pressure and accelerate a decline.
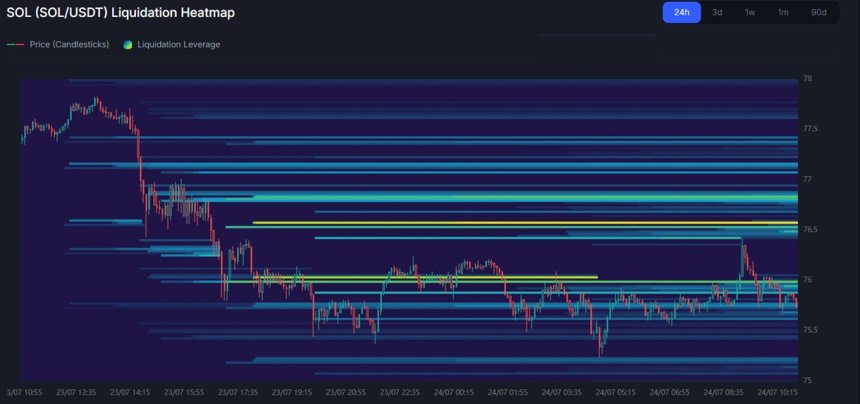
Recommendations for Traders
Bullish scenario: If Solana holds support around $73, the price could turn back toward $75. A break back above that level, combined with a breakout above the descending trendline, would improve the odds of a move into the $76.50–$76.80 zone, where the largest cluster of potential short liquidations sits.
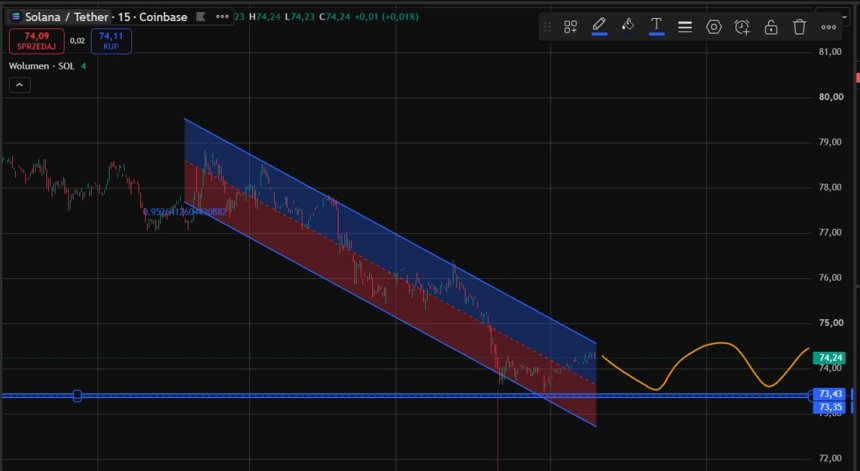
Consolidation scenario: If buyers defend $73 but Solana fails to reclaim $75, the price could trade sideways between these two levels. Such consolidation could persist until one side of the range breaks.
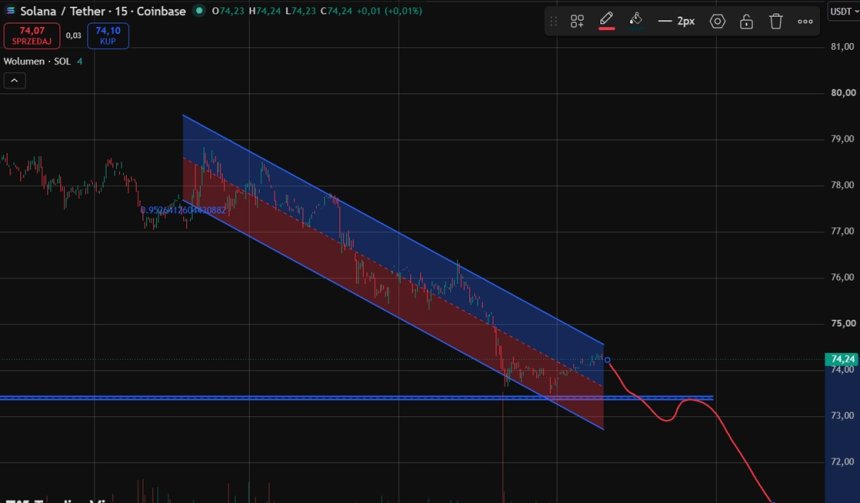
Bearish scenario: If Solana fails to hold support at $73, selling pressure could build again. A break below this zone would signal further weakness, though pinpointing the next downside target would require identifying the next support level on a broader chart.
Disclaimer: This material is for informational and educational purposes only. It does not constitute investment advice or a recommendation to buy, sell, or trade cryptocurrencies. The crypto market is highly volatile, so any investment decision shou