
Bitcoin Breaks Below Its Rising Channel
Bitcoin breaks below its rising channel as sellers target key support zones and traders await the Fed.


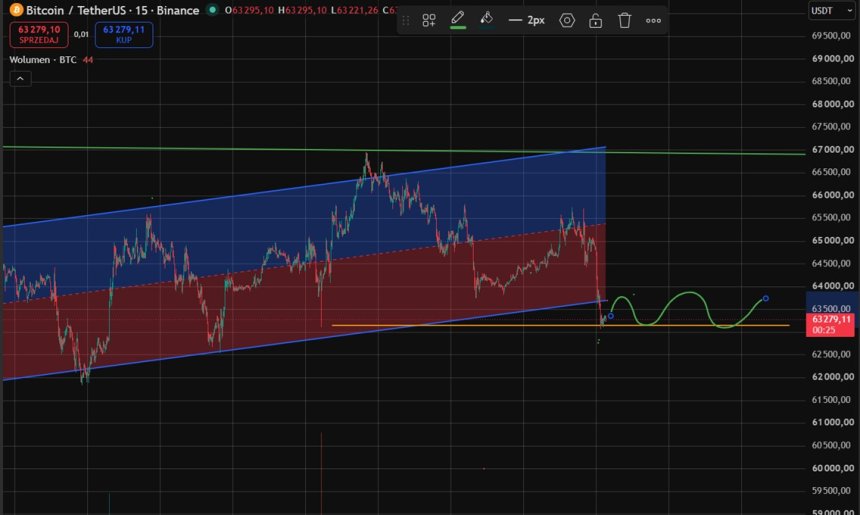
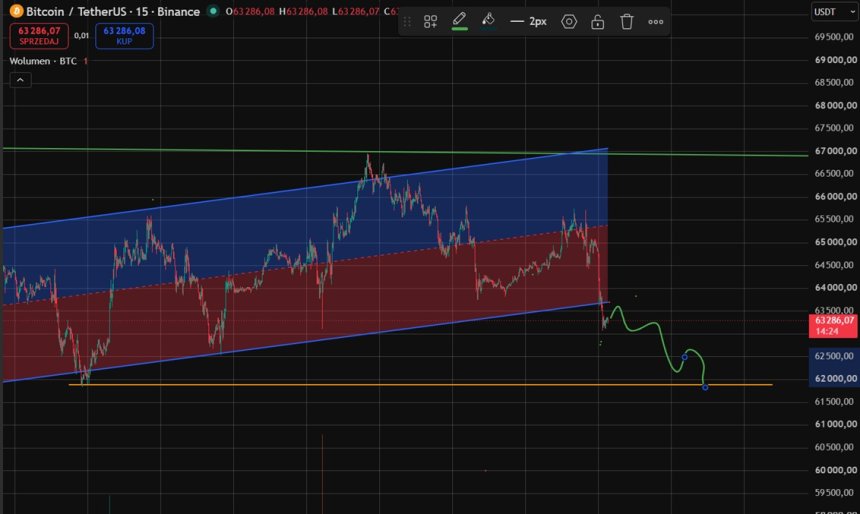
Bitcoin has fallen below the lower boundary of its short-term rising channel, deepening the ongoing correction. BTC declined from around $65,500 to approximately $63,200, while the breached $63,500–$63,700 zone may now act as the nearest resistance level. Buyers responded on the 15-minute chart, but the rebound remains modest and short-term selling pressure is still evident.
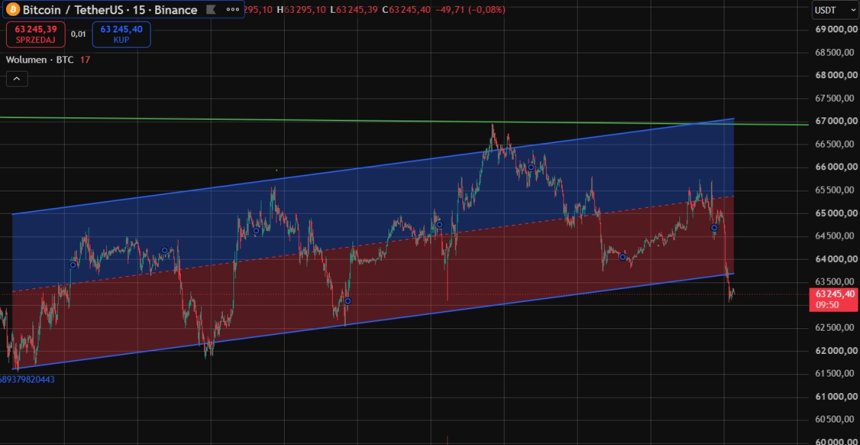
The decline was not triggered by any single piece of negative news related to Bitcoin. Instead, pressure is being driven primarily by concerns ahead of the US Federal Reserve’s decision, a stronger dollar and weaker demand from spot Bitcoin ETFs. The break below the channel’s lower boundary may also have triggered stop-loss orders and the liquidation of leveraged long positions, accelerating the downward move.
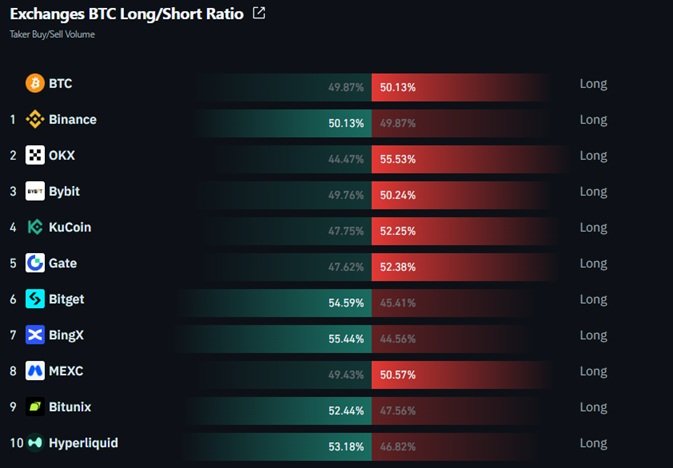
Market activity across the largest exchanges is almost evenly balanced, although sellers hold a slight advantage. Selling pressure is more pronounced on OKX, while buyers currently have the upper hand on BingX and Bitget.
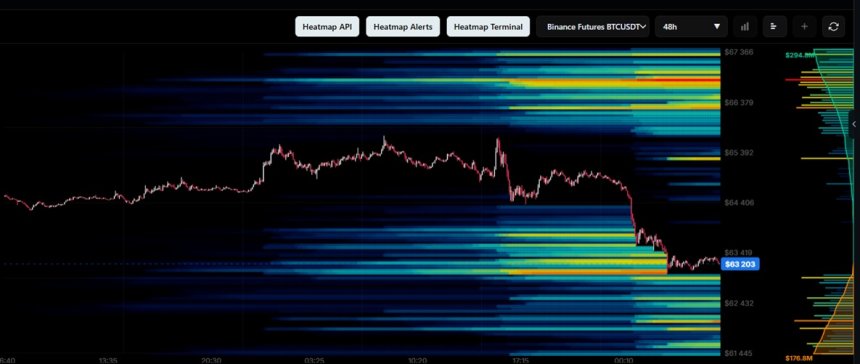
The liquidation heatmap indicates that the greatest risk for short positions lies between $66,400 and $66,900. Closer clusters can be seen in the $63,400–$64,000 range. Long positions, meanwhile, could face heavier liquidations if Bitcoin falls to around $62,000–$62,400, followed by the $61,400–$61,900 zone.
Guidance for Traders
Bullish scenario: Bitcoin could reclaim the lower boundary of the rising channel and move back inside it. A similar situation occurred on July 13, when the price briefly dropped below the channel before quickly recovering. A return above the $63,500–$63,700 zone would provide confirmation that market conditions are improving.
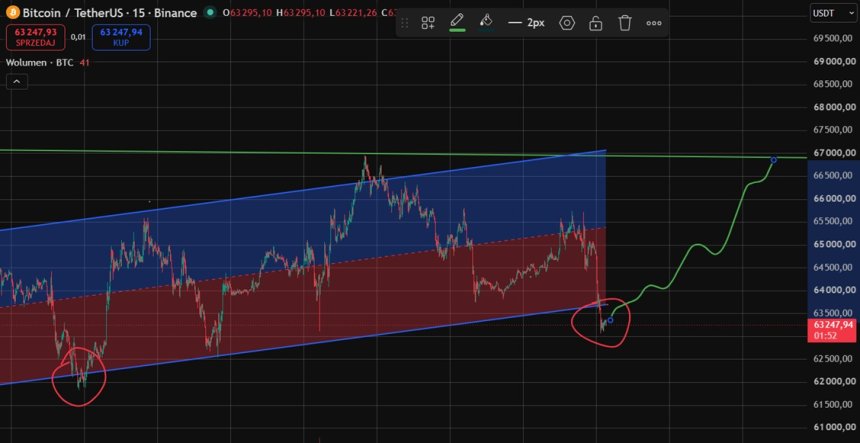
Consolidation scenario: If Bitcoin holds near $63,000 but fails to re-enter the channel, the price could trade sideways between support at approximately $63,000 and resistance in the $63,500–$63,700 range. A breakout beyond either boundary may indicate the direction of the next significant move.
Bearish scenario: There is no guarantee that the previous pattern will repeat itself. If BTC fails to return to the channel and the broken trend line turns into resistance, the price may continue falling toward the next support zones.
Disclaimer: This material is provided for informational and educational purposes only. It does not constitute investment advice or an invitation to buy, sell or trade cryptocurrencies. The cryptocurrency market is highly volatile. Every investment decision should therefore be preceded by independent research and take into account the risk of losing capital.