
Bitcoin Fails to Break Above $67,000
Bitcoin faces resistance at $67,000 as selling pressure raises the risk of a short-term pullback.


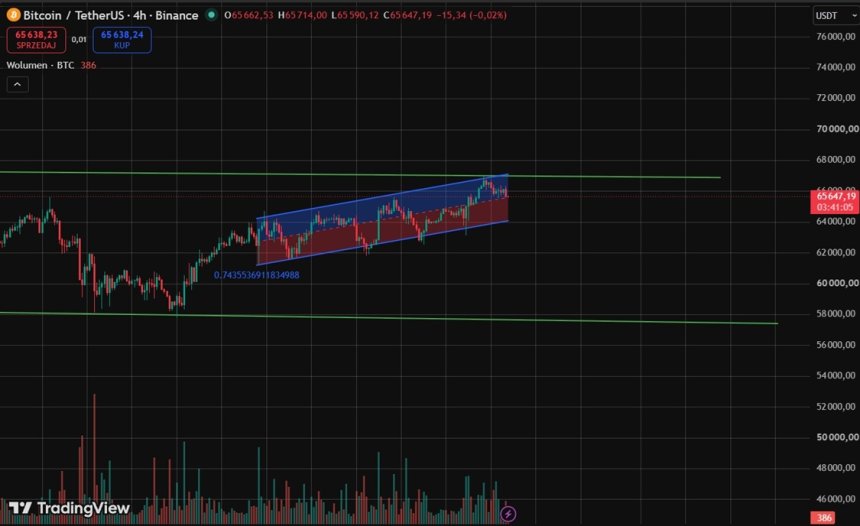
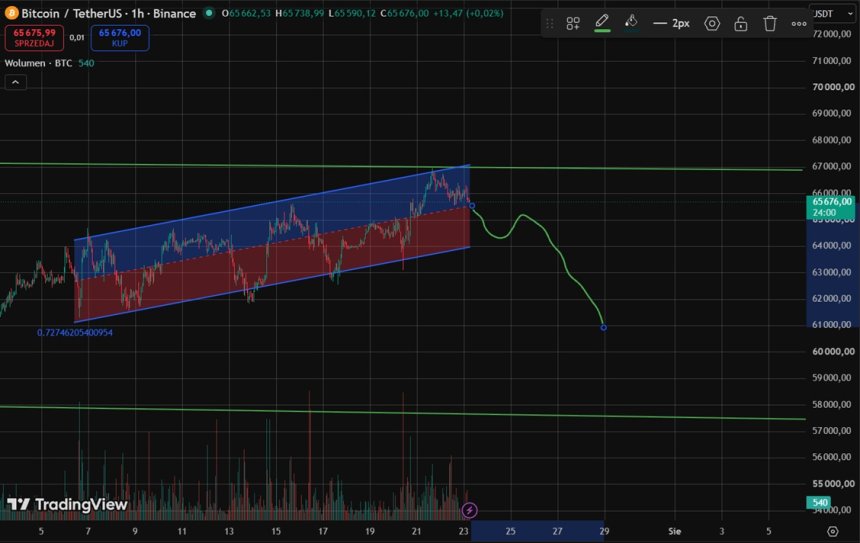
Bitcoin is currently trading within a short-term ascending channel on the four-hour chart. The price once again approached the key resistance area around $67,000, but buyers failed to secure a sustained breakout. Sellers stepped in near the upper boundary of the channel, pushing the price back toward $65,600. This suggests that $67,000 remains a major barrier to further gains.
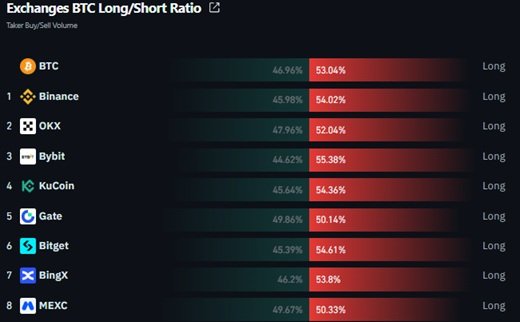
Selling activity currently outweighs buying across the largest cryptocurrency exchanges. Sell orders account for 53.04% of the analysed volume, compared with 46.96% for buy orders. The strongest selling pressure was recorded on Bybit (55.38%), Bitget (54.61%), KuCoin (54.36%), and Binance (54.02%). Gate and MEXC showed the most balanced activity.
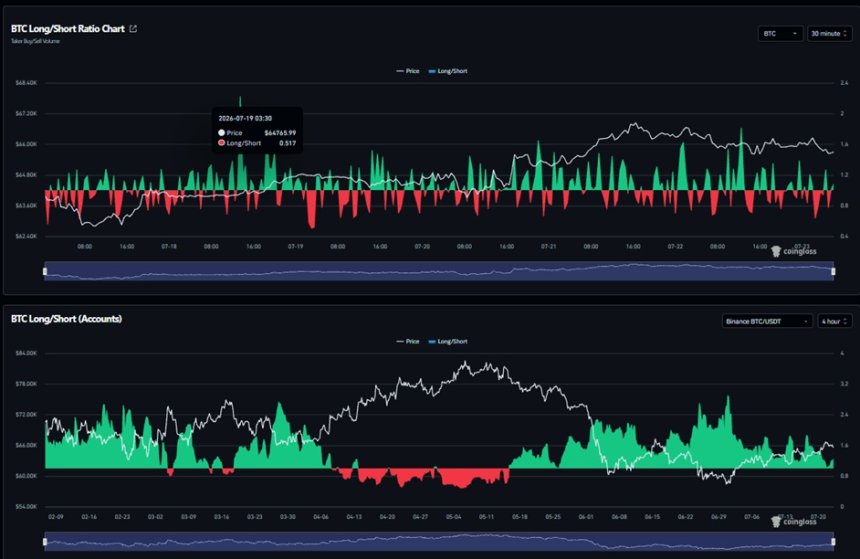
However, data on the number of accounts presents a different side of the market. More traders are holding long positions than short positions, but this does not necessarily mean that buyers dominate in terms of transaction value. Put simply, a larger number of smaller traders may be betting on further gains, while sellers are deploying more capital. As a result, the market remains under selling pressure even though more accounts are positioned for an upward move.
The liquidation map shows major clusters of positions on both sides of Bitcoin’s current price. The nearest and strongest zone below the market is located around $65,300–$65,400. A decline into this area could trigger widespread liquidations of long positions—trades opened in anticipation of further price increases. This could temporarily accelerate the sell-off, as exchanges automatically close highly leveraged positions.
On the upside, the largest concentration of potential liquidations is found between $66,600 and $66,800. If Bitcoin reaches this area, it could force short positions to close and trigger a short squeeze, causing the price to rise sharply. Another liquidation cluster is visible around $67,100–$67,400. However, the map does not indicate which level will be reached first. It simply highlights areas where price movements could become particularly volatile.
Recommendations for Traders
Bullish scenario: If Bitcoin breaks above $67,000 and maintains upward momentum above this level, buyers could take control of the market. Short liquidations may provide additional fuel for further gains.
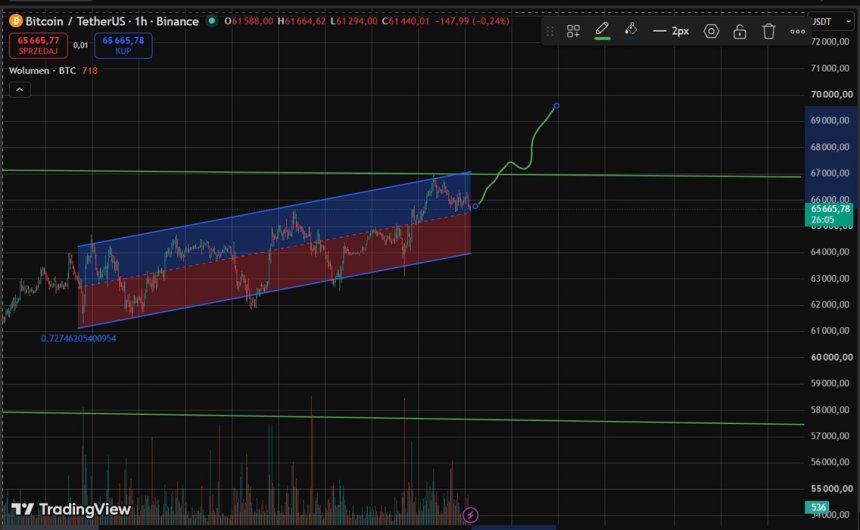
Consolidation scenario: If Bitcoin fails to overcome $67,000 but holds the $65,300–$65,400 support zone, the price may continue moving between these levels. The market would then remain in consolidation until a stronger catalyst emerges.
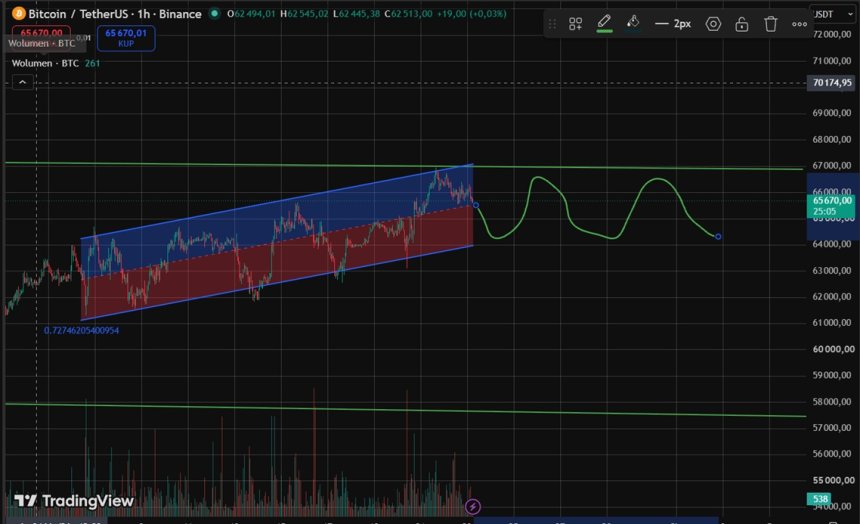
Bearish scenario: If Bitcoin falls below the $65,300–$65,400 zone, more long positions could be liquidated. This may intensify selling pressure and push the price toward the next support area at $64,600–$64,800.
Disclaimer: This material is provided for informational and educational purposes only. It does not constitute investment advice or an invitation to buy, sell, or trade cryptocurrencies. The cryptocurrency market is highly volatile. Every investment decision should therefore be preceded by independent research and should take into account the risk of losing capital.